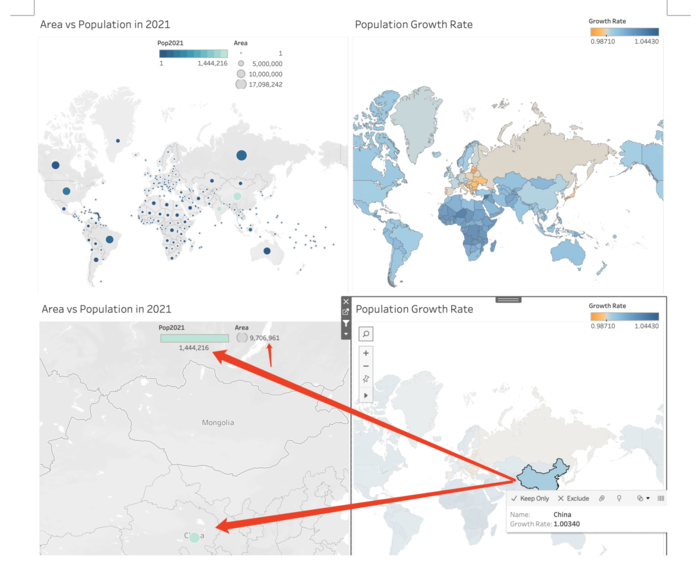
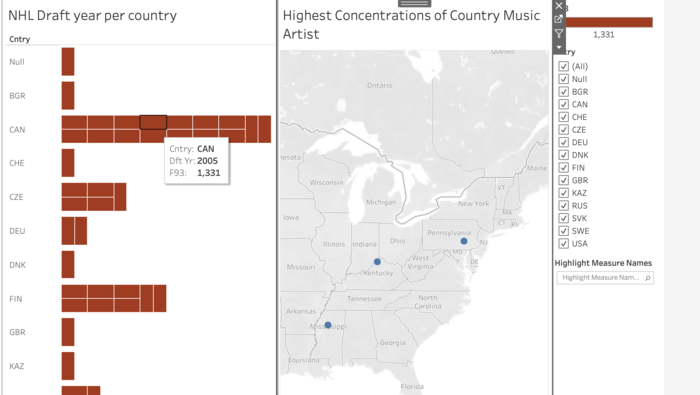
Used the bar chart as filter for the map and as a highlight
Global population growth changes.
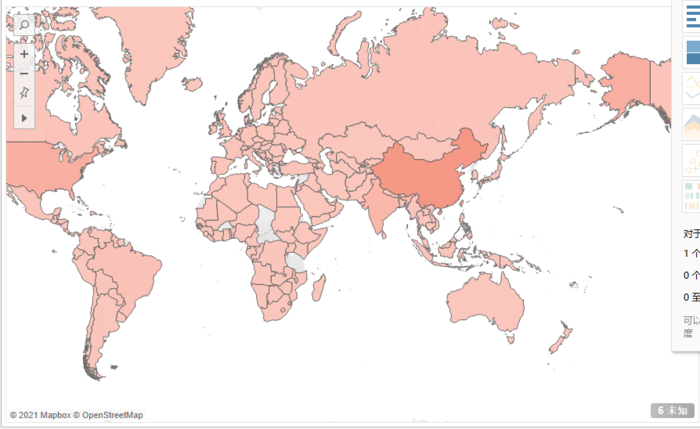
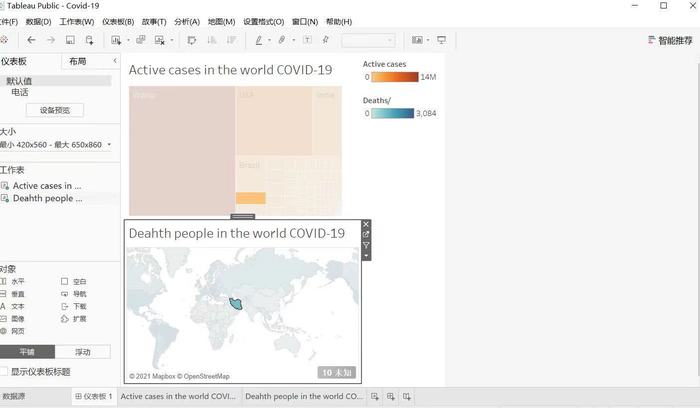
Place the mouse on the country in the second picture to know the number of patients in this country during the COVID-19 period. The number of deaths in this country in the first picture will be automatically displayed during the new crown.
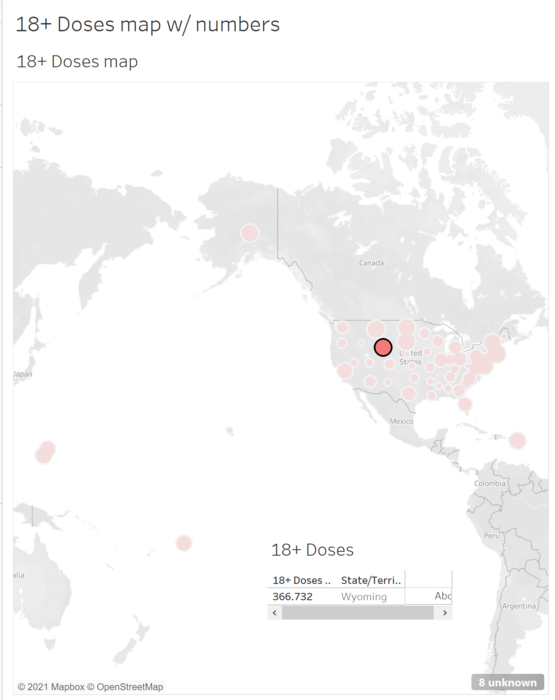
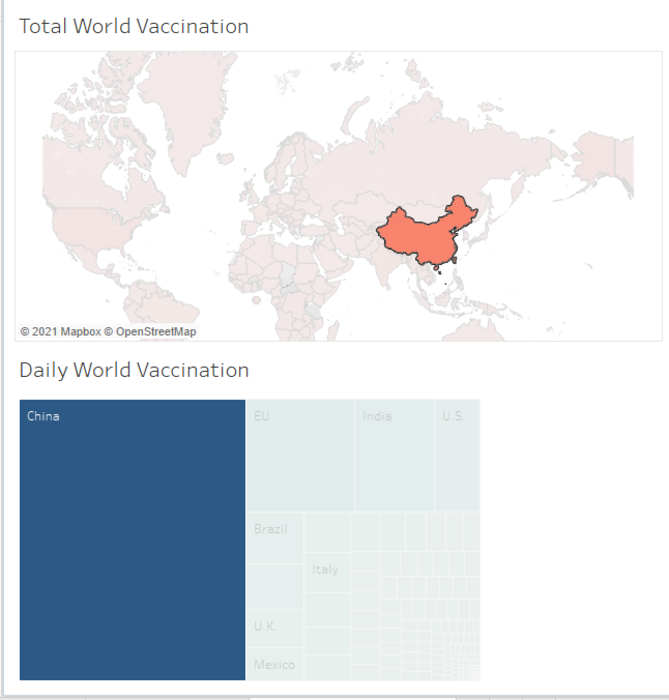
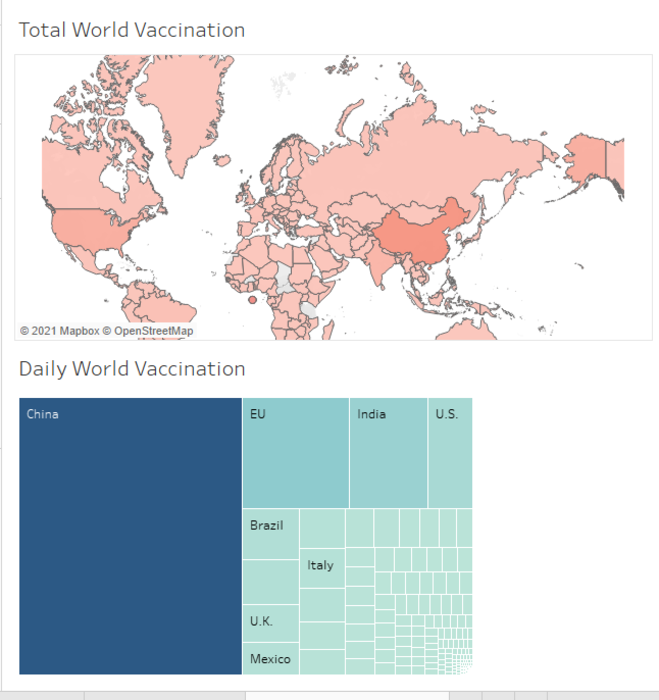
When you click on any country on the map, you can see the number of vaccinations per day in that country in the visualization below.
When you click on any country on the map, you will know the total number of vaccinations in that country.
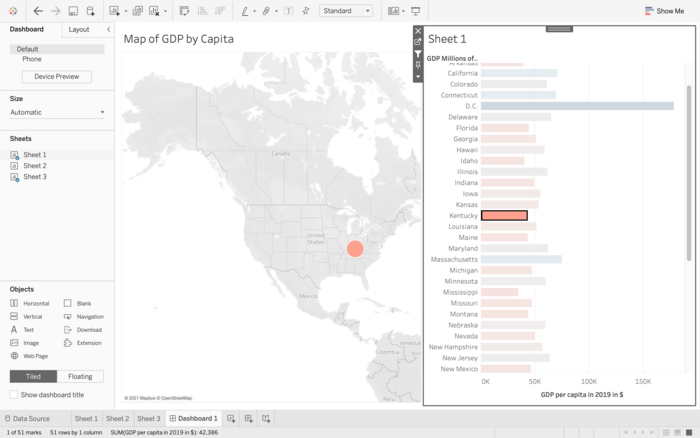
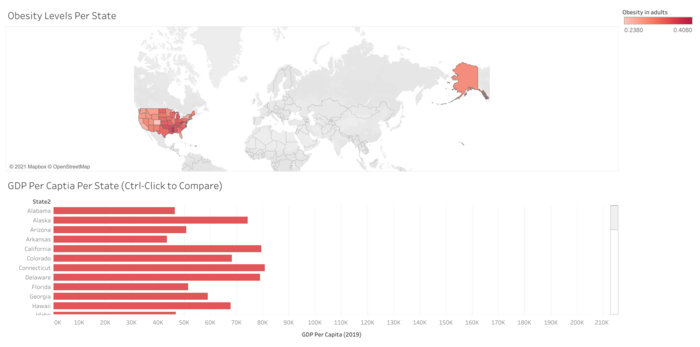
Obesity Levels VS GDP Per Capita for US
(By clicking a state on the map the corresponding state's GDP will be highlighted)(You can compare two state's GDP levels against each other by consecutively clicking each state)
Total World Vaccinated VS Daily World Vaccinated
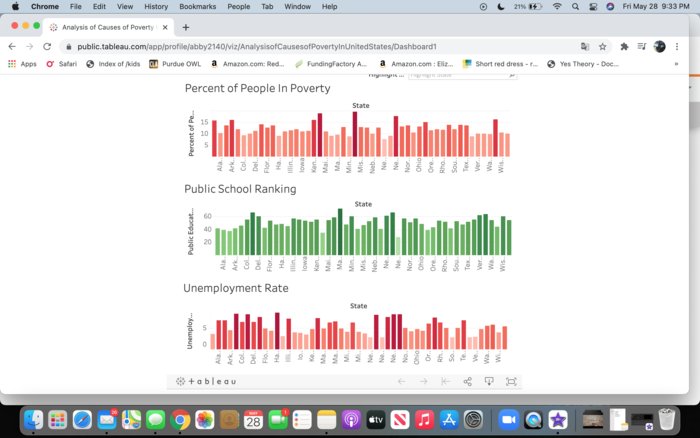
This data shows the correlation between the quality of public schools, unemployment rate and poverty rate in each US state.
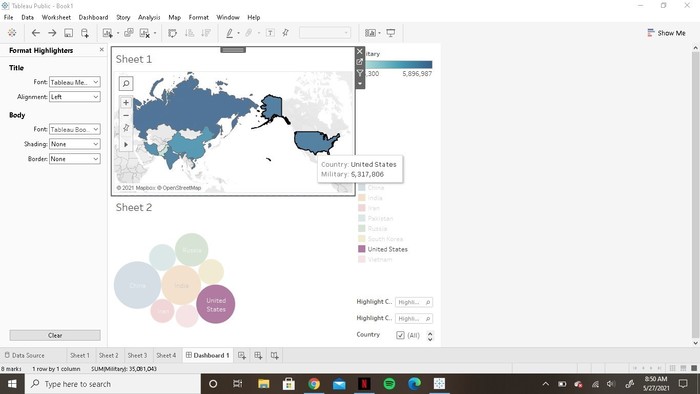
This is an interactive dashboard used to visualize the differences in the size of the active and total military of 8 countries. By hovering over the a certain country in the map a corresponding bubble is highlighted to show the proportion of its active military with other countries.
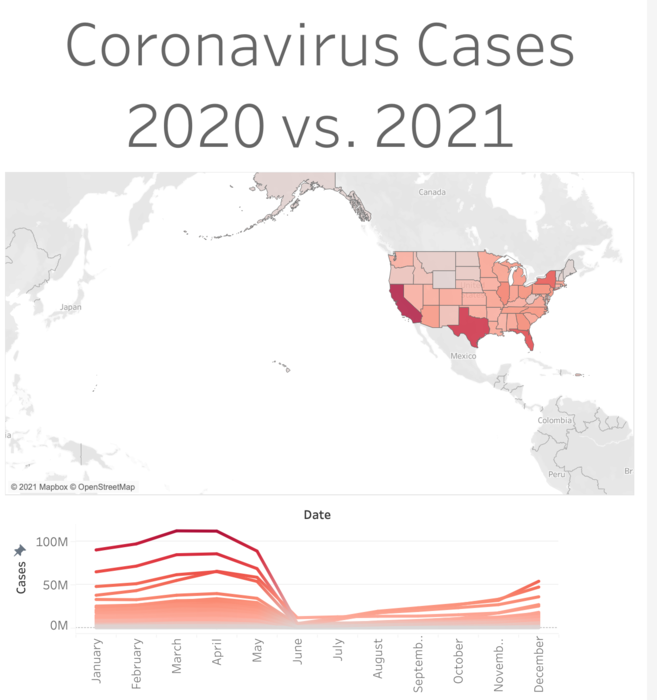
When a state is clicked on the map for covid-19 cases, a line in the line chart is highlighted showing the cases through the year.
The number of country music singers compared with NHL draft numbers.

 dongyao-wang
Over 4 years ago
dongyao-wang
Over 4 years ago
 yuheng-long
Over 4 years ago
yuheng-long
Over 4 years ago
 maxx-simeon1
Over 4 years ago
maxx-simeon1
Over 4 years ago
 22guenthera
Over 4 years ago
22guenthera
Over 4 years ago
 vince0731
Over 4 years ago
vince0731
Over 4 years ago